
This project uses OpenWeatherMap's weather API and After Effects together to make a fully modular Weather Display animation. You can see the reel I put together which shows the workflow.
How it works
I used the data from OpenWeatherMap's weather and forecast API.
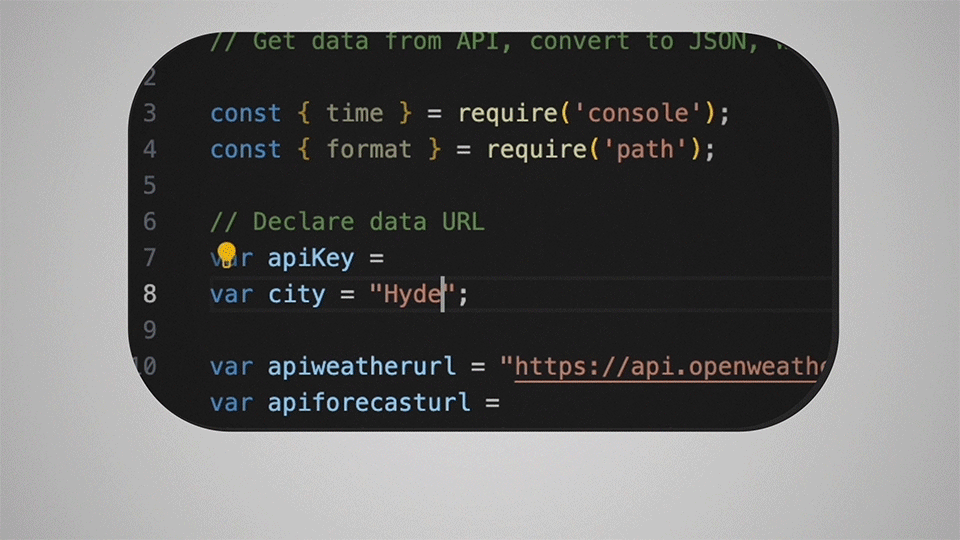
It takes the city name as the input. The JS code accesses the url and saves the weather data in 2 JSON files.
Once the Javascript code is run, the data updates in After Effects.
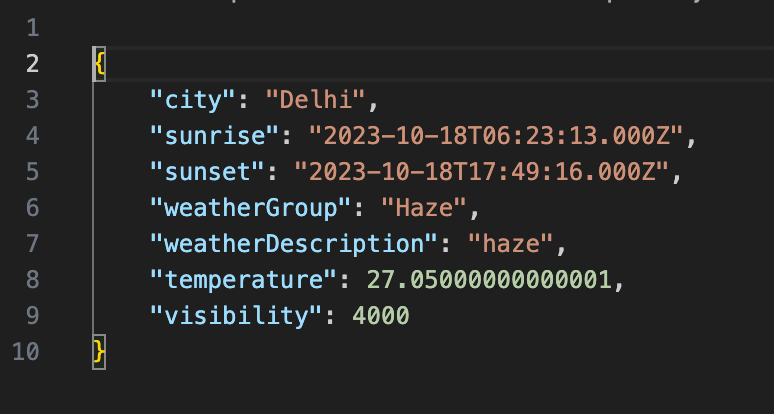
The City JSON consists of general data like the city name, sunrise and sunset times, weather data for the day etc.,
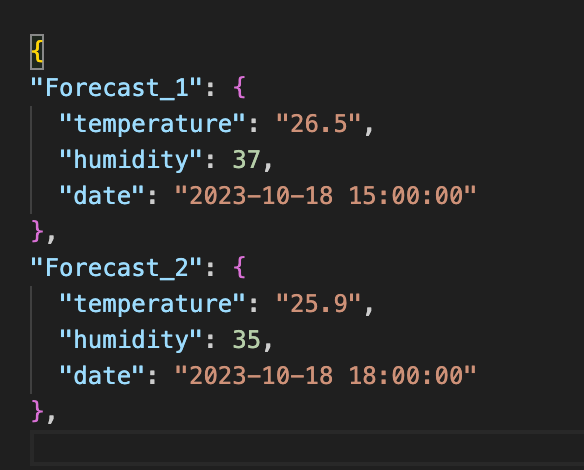
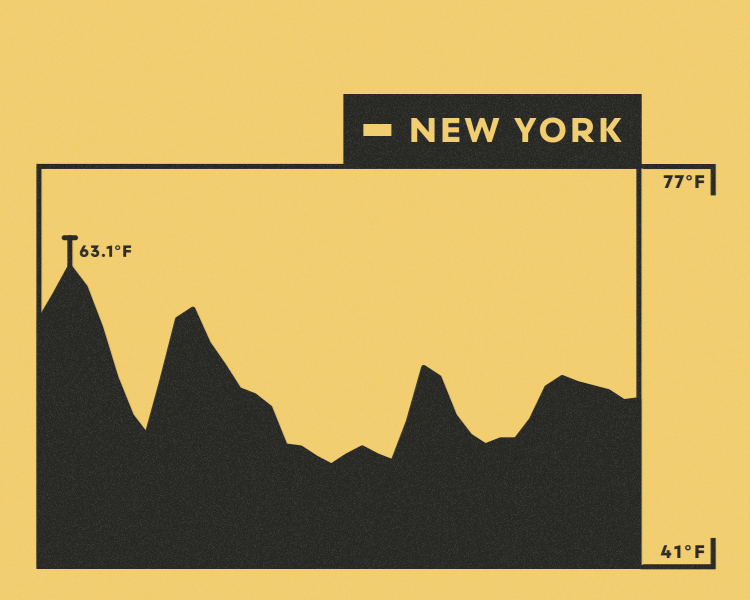
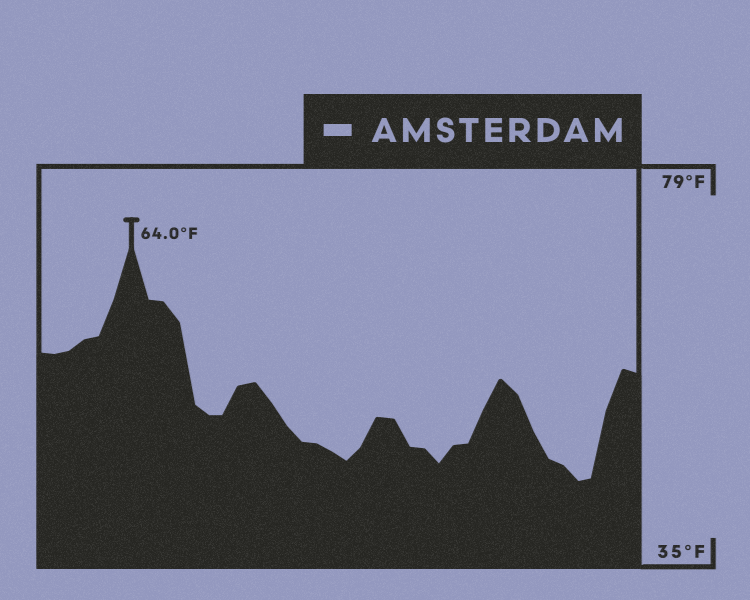
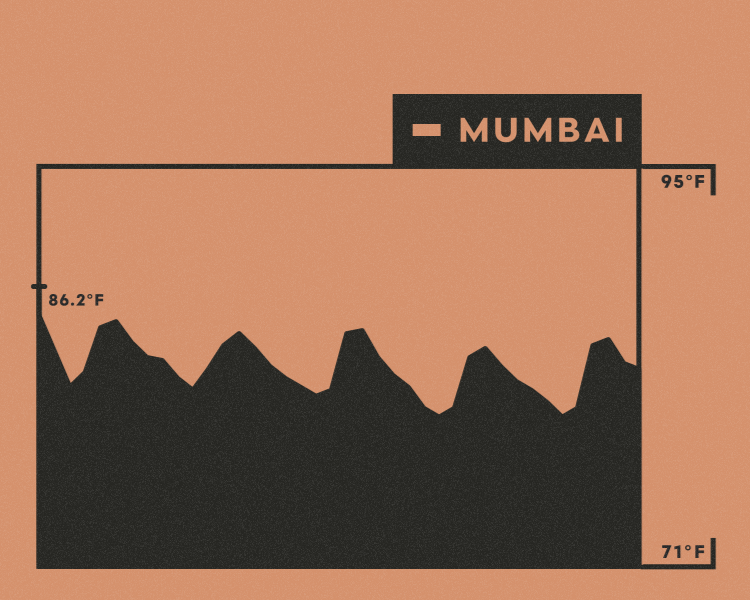
The Forecast JSON consists of temperature and humidity data for the next 5 days from the current date.
Then I worked on AE file to make it fully modular. I worked with AE expressions to so that all the elements adapt to the data.
For example, the elements like the boundary box around the city, the position of the accent rectangle next to to the city name, The size of the rectangle visibility rectangle etc., are controlled by expressions.

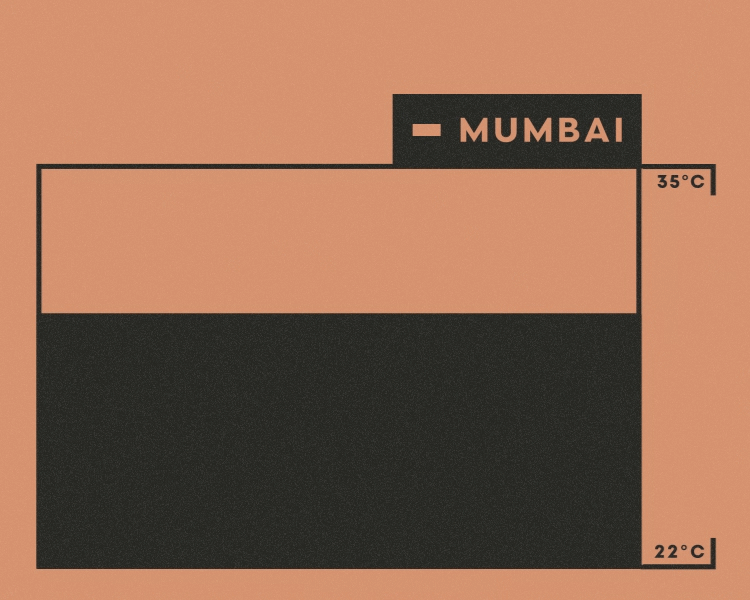
The colors are controlled by the "weather group". There are 7 main categories so I chose 7 colors to correspond to each category.
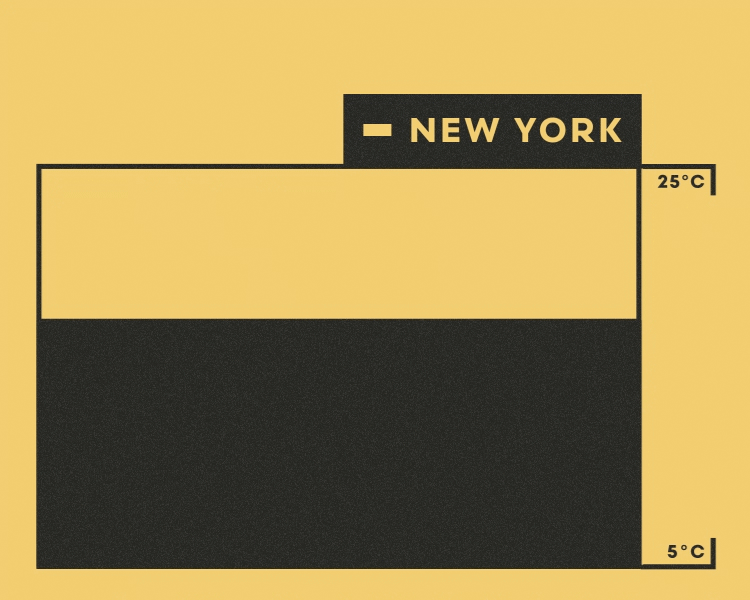
The temperature plot is coded so that the plot sizes stay consistent regardless of the temperature range. The maximum temperature indicator also adapts to the plot automatically. There is also a toggle that switch metric and imperial units.

Here's the overall animation at the end of all the coding.

If you're interested in creating something like this, email me at hey@kruthihv.com. Thank you.